Do you know how to create custom reports in QuickBooks Desktop? Customizing reports in QuickBooks Desktop is like tailoring a suit: you want it to fit perfectly and highlight the right details. Similarly in the context of your business finances, you can make all the difference by streamlining and automating all the operational and even the non-operational processes. Whether you’re managing a small business or a large company, QuickBooks not only allows you to optimize the overall processes but also empowers companies with pre-build as well as tailored reports.
Custom reports in financial management provide tailored insights into an organization’s financial health. With the help of custom reports, you can filter your data and adjust presentation formats to focus on the most relevant metrics. QuickBooks Desktop offers a range of ready-to-use reports to simplify financial management. But what if those readymade reports don’t meet your requirements? No worries, because with QuickBooks, you can customize reports to track specific data, including account numbers, descriptions, and more.
In this blog, we are going to help you with the steps to run and customize reports in QuickBooks Desktop. Let’s get started!
Customize Reports in QuickBooks Desktop Effortlessly
With QuickBooks Desktop, you can customize any report to suit your needs. Make changes to the data, modify or remove columns, change header or footer details, and even tweak the font and design.
As each report pulls data from your company file differently, the columns and filters available vary. When applying filters, understanding the source and target of each report is crucial.
Customize Reports
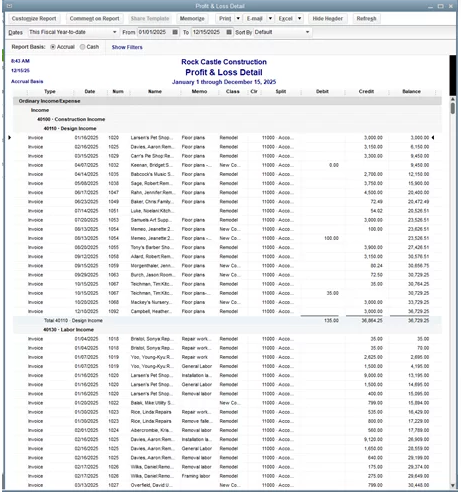
Here’s how to run and customize reports in QuickBooks Desktop:
- Run a report to get started.
- Click Customize Report in the report window.
- Once you click on the Customize Report tab, you will see the Modify Report option.
This feature further offers several options, including the following:
1. Display Tab
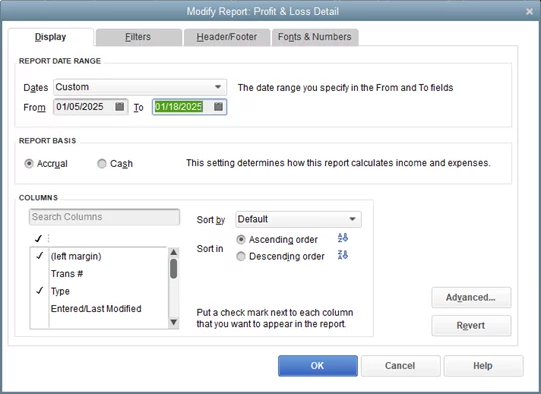
Depending on the report you’re working with, the Display tab lets you customize the information that appears in the report.
- Report Date Range: Select the date range the report covers from the Dates drop-down menu. Then select a preset date range or manually enter the dates by clicking the calendar icon in the From and To fields. The report will show data up to the specified date if you leave the From date blank.
- Report Basis: Choose Accrual or Cash to define the accounting method for the report.
- Columns: Column options depend on the type of report you’re creating:
- Display Columns by: In reports such as Profit and Loss and Balance Sheet, you can select how columns are displayed (e.g., by total, by day, by item type). Alternatively, reports such as Open Invoices and Unpaid Bills Detail allow you to customize the column list. Form templates that include Custom fields will also appear in this list if you have set them up. You can add or remove columns by selecting the desired data; selected columns will be marked with a checkmark.
- Sort by: Select the “Sort by” drop-down menu to determine how the data is arranged within the report (e.g., by Default, by Total). Within subtotals, you can sort data ascending or descending.
- Add Subcolumns: Subcolumns can be added to some reports to add more detail and organization.
- Advanced: There are different options available when selecting the “Advanced” button depending on the report you are working with. Reports such as the General Ledger, Custom Summary, Custom Transaction Detail, Sales by Customer, Sales by Item, Sales by Rep Detail, Customer Balance Detail, and Vendor Balance Detail include the following options:
- Include: Indicates which accounts, items, or names QuickBooks will display.
- All: Contains all account and list elements.
- In Use: Includes only elements and accounts with activity during the selected period.
- Open Balance/Aging: Displays the open balance of a transaction as of the report’s effective date.
- Current: Provides open balances as of today, regardless of the report’s date range.
- Report Date: Shows open balances based on selected dates.
- Include: Indicates which accounts, items, or names QuickBooks will display.
For reports like Profit and Loss, Balance Sheet Standard, Statement of Cash Flows, and Customer or Vendor Balance Summary, the options include Display Rows and Display Columns, which specify the rows and columns to be shown in the report.
Display Rows/Display Columns:
- Active: Any row or column showing activity within the selected date range, regardless of balance.
- All: Displays all rows and columns, regardless of filters.
- Non-Zero: Removes columns and rows with zero balances, displaying only those with positive balances.
- Reporting Calendar:
- Calendar Year: Displays January-December balances.
- Fiscal Year or Income Tax Year: Based on your company’s information settings.
2. Filters tab
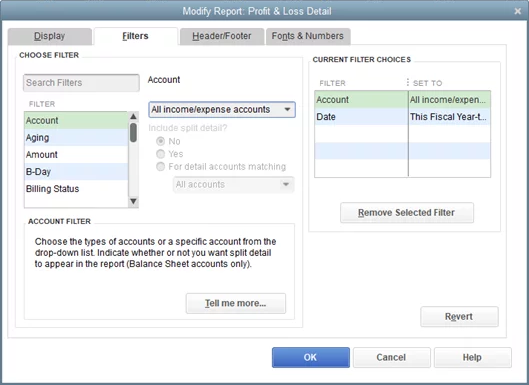
It is crucial to use filters to narrow down data in reports when customizing or troubleshooting them.
To apply filters to a report:
- Choose a filter from the list.
- Provide QuickBooks with any additional information necessary to ensure the filter works properly.
- Select Remove Selected Filter from the current filter list.
- Click OK to confirm.
Note: In case you’re noticing 2 classes on filters while customizing a particular report, select the class that is connected to all classes.
3. Header/Footer Tab
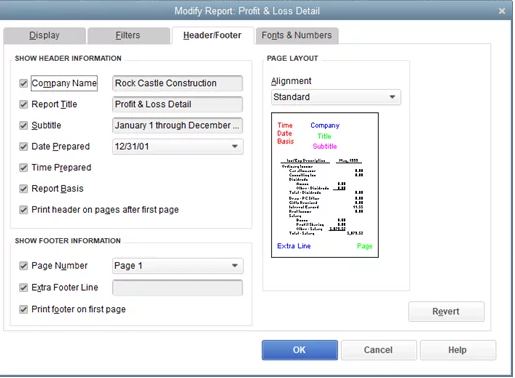
You can adjust the details shown at the top (header) and bottom (footer) of the report by clicking this tab.
Footer information appears below the report data in the print preview or printed copy. The header contains information above the report data. You can add or remove content by checking or unchecking the relevant boxes and updating the details using the provided field.
To change the alignment, select an option from the Alignment drop-down menu.
4. Fonts & Numbers Tab
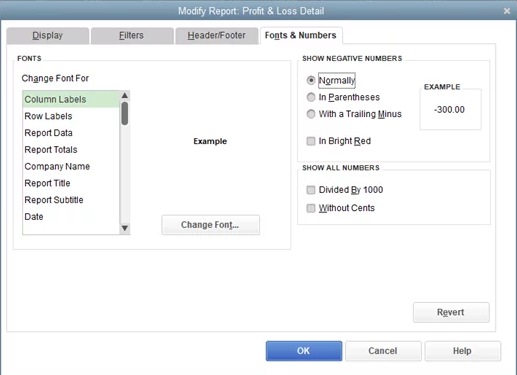
You can modify elements like font, font size, and style on this tab to change the style and appearance of a report.
To change the font:
- Choose the area you wish to update in the “Change Font For” column.
- Select “Change Font….”
- Set the color, font, size, style, and effect of the column labels in the “Column Labels” window.
- To continue, click “OK.”
- To apply the changes to all labels, click “Yes” when prompted.
There is a limit of 57 characters for titles, but you can include subtitles (note that this will hide the date range). The original report can be viewed by selecting “QuickBooks Desktop Help” under the Help menu.
Collapse Columns
When you collapse report columns associated with jobs or classes in QuickBooks Desktop, you can view totals by job or class without scrolling or exporting to Excel.
- You can collapse individual columns by clicking the “–” on the left.
- Select “Collapse Columns” from the report menu bar to collapse all jobs or classes.
- To view details again, click on “+” or select “Expand Columns.”
Note: You can only access this feature if you have sub-jobs or sub-classes.
So, this is how you can edit different tabs to create customized reports in QuickBooks Desktop. Moving ahead, let us discuss how to create custom summary and custom transaction detail reports.
Custom Summary and Custom Transaction Detail reports
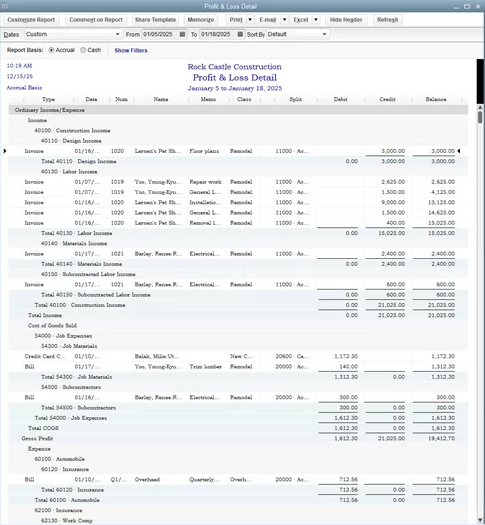
With the Custom Summary and Custom Transaction Detail reports in QuickBooks, you can design almost any report you need. By adjusting options in the Display and Filters tabs of You can design almost any report you need with QuickBooks’ Custom Summary and Custom Transaction Detail report limits, and user permissions might affect the final result.
A. Custom Report Summary
Here’s how you run it:
- Choose Custom Reports from the Reports menu
- Then select Summary.
Create tailored income statements to evaluate the profitability of specific areas of your business using this report. This report is similar to a standard profit and loss report, but with more flexibility, allowing you to see profitability for jobs, items, or classes.
The Custom Summary Report window will appear when this report is generated. The “Row Axis” drop-down list allows you to customize how profit and loss data is displayed. When you select “Job” from the list, the report will show profit or loss by job from your Customers & Jobs list.
It is important to keep in mind that rows and columns should represent distinct categories. Since both customers and vendors belong to the Name List, you can’t place them in the columns.
Double-click a figure to view the transactions behind it.
B. Custom Transaction Detail Report
To run the report:
- Access the Reports menu.
- Then choose Custom Reports.
- Finally, pick Transaction Detail.
In this report, every transaction is broken down by account and displayed separately. If you write a check to the phone company, it would appear twice – once as a deduction from your checking account and again as an allocation to your telephone expense account.
The report covers the current month-to-date by default, but you can adjust the date range via the Dates dropdown menu.
Double-click an entry to view its full details.
QuickZoom Reports
It refers to a magnifying glass icon that generally appears in reports and graphs. You can view more detailed information about a figure or item when it appears over a number in a report by double-clicking it.
Double-click on a specific transaction to open it in its original form.
A. Transaction Detail by Account
This QuickZoom report shows the individual transactions that contribute to the amount you double-clicked in the profit and loss report. The QuickZoom report will display specific transactions QuickBooks used to calculate the income if you double-click the total income figure.
B. Transaction by Account
A QuickZoom report shows the individual transactions that make up the amount you double-clicked on in your balance sheet. You can create and customize reports using QuickBooks Desktop Enterprise, which offers the most advanced reporting features.
- Customer, job, and sales reports
- Vendor reports
- Item reports
- Company and financial reports
- Payroll and employee reports
You can run reports in QuickBooks Desktop to gain detailed financial insight, helping you monitor and manage your business more effectively.
Conclusion
QuickBooks Desktop allows you to customize reports according to your specific needs so that you can gain valuable insight into your company’s finances. It allows users to adjust the report parameters and focus on income tracking and expense monitoring. With the help of custom reports, you can make informed decisions and drive business growth by improving financial management and strategic planning.
If you’re facing any trouble with creating custom reports in QuickBooks Desktop, then we are here to assist you in the best possible manner. Connect our certified and skilled professionals via call: +1-888-245-6075.
Frequently Asked Questions
Absolutely! Saving a customized report in QuickBooks Desktop is simple. Once you’ve customized the report, select the Memorize option to save it. Access the saved report later from the Memorized Reports list in the Reports menu.
Yes, you can export a customized report to Excel. Click on the Excel button within the report window. Customize the Excel template by navigating to the Reports menu, selecting Excel, and then clicking on Customize Excel for further adjustments.
Removing a customized report involves the following steps:
1. Go to the Reports menu.
2. Click on Memorized Reports.
3. Choose the option to remove the report.
4. Hit the Delete button to remove the report.
Absolutely! You can share a customized report with other users in QuickBooks Desktop. Export the report to Excel or PDF and then share it. Alternatively, save the report as a template and distribute it to other users.

